Core Web Vitals guide: what they are and how to improve them
Translated from the Spanish original. Leer en español

You open PageSpeed Insights, paste your website's address and three letters appear in green, orange or red: LCP, INP and CLS. Someone told you they matter for Google, but nobody has explained what each one measures or where to start fixing.
Here is the complete map. Every technical fact carries its link to Google's official documentation in the same sentence, and when something is my own criterion and not Google's, I say so.
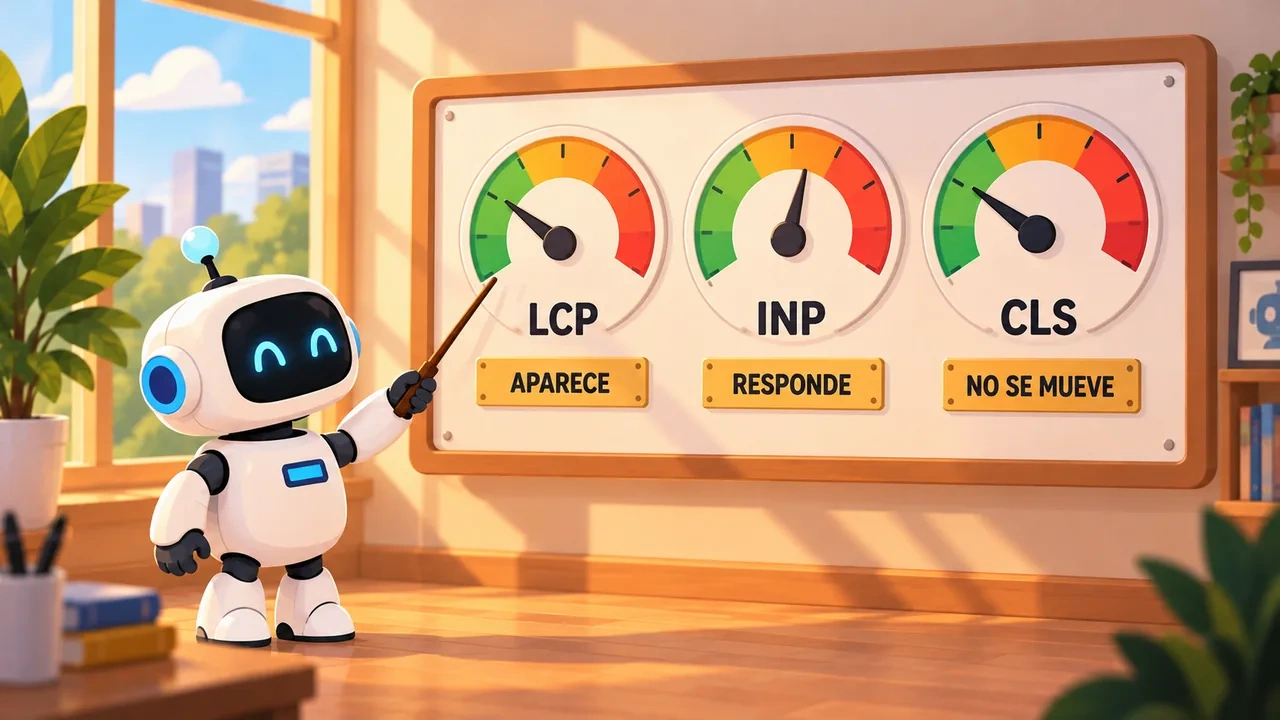
Short answer: Core Web Vitals are three measures of the real experience of whoever visits your page: LCP (how long the main content takes to appear), INP (how long it takes to respond when tapped) and CLS (how much the content moves). Google recommends an LCP of 2.5 seconds or less, an INP of 200 milliseconds or less and a CLS of 0.1 or less.
Before getting into it, this is a summary of what you are going to read:
| Metric | Question it answers | Good | Poor |
|---|---|---|---|
| LCP | How long does the main content take to appear? | 2.5 s or less | more than 4 s |
| INP | How long does it take to respond when I touch something? | 200 ms or less | more than 500 ms |
| CLS | Does the page move while I read it? | 0.1 or less | more than 0.25 |
If you cannot see all the columns, scroll the table sideways.
What are Core Web Vitals and why do they matter for SEO?
Core Web Vitals are a set of metrics that measure the real loading, interactivity and visual stability experience of a page, according to the Google Search Central documentation. Google recommends them for success in Search and for delivering a good experience in general.
They matter because they measure what whoever arrives at your website feels, not what a robot sees. A page that is slow to show the main content, that doesn't respond when tapped or that moves while you read spoils the visit before it starts.
In the Search Console from scratch guide we saw where the report appears. Today we go down to what each number means and what to do with it.
What does each metric measure: LCP, INP and CLS?
LCP measures how long it takes to paint the largest visible element on the page, usually a large image or a block of text. It is the time from when the user starts loading the page until that element is on screen, according to web.dev.
INP measures the page's responsiveness. An interaction is a click, a tap or a key press, and the measure reflects how long passes until the browser shows the visual result, according to the web.dev INP guide. The web.dev Core Web Vitals page explains that INP replaced FID as a stable metric in 2024.
CLS measures visual stability: how much elements shift unexpectedly during the life of the page. It is that feeling of going to tap a link, something loads on top and you end up tapping something else. Shifts that happen within 500 milliseconds after a user interaction don't count, according to the web.dev CLS guide.
Do they really improve rankings?
They do count, but they are not the main factor and guarantee nothing. Google says on its page experience page that its core ranking systems use Core Web Vitals.
The same page makes three things clear that are worth reading calmly:
- There is no single "page experience signal": the systems look at a variety of signals.
- Having good results in the Search Console report or in third-party tools doesn't guarantee ranking high.
- There is more to a good page experience than Core Web Vitals scores.
My reading, and it is my own criterion: a page with excellent content and one metric in orange can still rank, and a super fast page with weak content isn't saved by that. Don't stop writing good pages to chase a score. A website being fast doesn't fix the rest of SEO: we saw it in Astro flies, but that doesn't mean your SEO does too.
Which values does Google consider good?
Google considers good an LCP of 2.5 seconds or less, an INP of 200 milliseconds or less and a CLS of 0.1 or less. This is stated in the Search Central documentation.
Each metric also has a "poor" threshold. According to the web.dev guides on LCP, INP and CLS, poor is an LCP above 4 seconds, an INP above 500 milliseconds and a CLS above 0.25. What lies in between "needs improvement".
| Metric | Good | Needs improvement | Poor |
|---|---|---|---|
| LCP | 2.5 s or less | between 2.5 s and 4 s | more than 4 s |
| INP | 200 ms or less | between 200 and 500 ms | more than 500 ms |
| CLS | 0.1 or less | between 0.1 and 0.25 | more than 0.25 |
If you cannot see all the columns, scroll the table sideways.
The value measured is the 75th percentile of visits, separating mobile and desktop. A page passes the Core Web Vitals assessment if it meets the good target on all three metrics at once, according to web.dev.
Where do I see my Core Web Vitals with real data?
You can see them in Search Console's Core Web Vitals report and in PageSpeed Insights, and both use real-user data when there is enough. It is best to look at real data first and lab data afterwards.
The Search Console report groups URLs by status (poor, needs improvement, good), by metric type and by group of similar pages, according to the report's official help. A group's status is that of its worst metric: if CLS is poor and INP is good, the group is listed as poor.
If your property says "No data available", it isn't a fault of your website. The same help explains that it may be a new property or that the Chrome User Experience Report (CrUX) doesn't have enough data for that device. In that case, the report omits URLs without a minimum of data.
PageSpeed Insights separates two types of data, according to its official documentation:
- Field data comes from real Chrome users during the previous 28 days. If a page doesn't have enough data, PageSpeed Insights shows that of the whole origin.
- Lab data is generated by Lighthouse simulating the load. It is useful for debugging, but may not reflect what the real user experiences.
web.dev's recommendation is to go to real data first and, if Lighthouse and CrUX don't match, trust CrUX. To understand where that public data comes from, look at how Chrome turns ad load into public data, which uses the same source.
How do I improve LCP?
To improve LCP you have to optimize the whole loading process, not a single step: web.dev warns that a single fix rarely achieves a major improvement. The first step is knowing which element is your LCP.
With PageSpeed Insights or Chrome's developer tools you can see which is the LCP element of each page. From there, web.dev proposes splitting LCP into four parts and reducing each one, according to its LCP optimization guide:
| LCP part | Ideal percentage |
|---|---|
| Time to first byte (TTFB) | close to 40% |
| Resource load delay | less than 10% |
| Resource load duration | close to 40% |
| Element render delay | less than 10% |
If you cannot see all the columns, scroll the table sideways.
These percentages serve to compare the parts with each other, not to turn them into seconds. The guide itself warns about it.
Slow server, redirects and distance
A high TTFB can be due to several server redirects, to visitors far from the nearest server, to a poor network or to not being able to use cached content because of URL parameters, according to the same guide. A very high TTFB can make it hard or impossible to reach 2.5 seconds.
My criterion, not a Google quote: quality hosting and a content delivery network (CDN) bring the content closer to the visitor and are usually the first review when TTFB is the problem.
The main image: discoverable, with priority and no lazy load
The web.dev guide says the LCP resource must be discoverable in the initial HTML. If it is only referenced from a CSS or JavaScript file, it is worth preloading it with high priority, and if it is an image you can indicate it with the fetchpriority attribute.
The clearest warning in that guide: never lazy load the LCP image, because it causes an unnecessary delay and hurts LCP. If your main image has loading="lazy", remove it.
Lighter images, but measure the effect
Reducing the image weight with more compression or a better format, such as AVIF or WebP, shortens the load duration. According to web.dev, that doesn't always improve LCP, because the time saved can move into the element render delay. That is why all four parts are optimized and not just one.
How do I improve INP?
To improve INP you have to reduce the work that blocks the browser's main thread, so the page responds sooner to each tap. web.dev divides each interaction into three parts and proposes acting on each one.
According to the INP guide, the three parts are the input delay (until the event functions start running), the processing duration (how long they take to finish) and the presentation delay (until the browser paints the next frame with the result).
Long tasks and scripts
A long task is any that lasts more than 50 milliseconds, according to the web.dev long tasks guide. While the browser processes it, it can't handle other interactions.
Script evaluation is a frequent cause during loading: after downloading a JavaScript file, the browser still has to parse, compile and run it. My criterion, not Google's: review which scripts and plugins you keep loading unnecessarily and remove the ones you don't use.
Breaking up the work to yield
The technique web.dev proposes is called yielding to the main thread: splitting the work into smaller tasks so the browser can attend sooner to what the user asks. You can do it with setTimeout or with scheduler.yield, according to the long tasks guide.
It also recommends doing first only what is needed to paint the visual change and leaving the rest for a later task. With that, event functions are lighter and the browser paints sooner.
A smaller DOM
When the DOM is very large, rendering work grows with it, according to the INP guide. Reducing its size helps the presentation delay, although the guide itself admits that sometimes it can't be reduced much.

How do I avoid layout shifts (CLS)?
To avoid layout shifts you have to reserve the space of everything that loads later than the text: images, videos, ads, embeds and fonts. If the browser knows how much room each thing takes before it arrives, it moves nothing.
Images and videos with dimensions
web.dev recommends always including the width and height attributes on images and videos, or reserving the space with the CSS aspect-ratio property, according to its CLS optimization guide. With responsive images, all those you offer in srcset must have the same aspect ratio.
Ads, embeds and late-arriving content
YouTube videos, maps or social media posts usually don't reserve space until they load. The guide proposes reserving the space with min-height or, in responsive content, with aspect-ratio.
With ads you can't always know the exact size. The guide suggests choosing the most likely size based on historical data or starting with the smallest size to be served, and avoiding collapsing the reserved slot if no ad arrives, because removing the space causes as much CLS as inserting content.
Web fonts
Switching from the fallback font to the web font can cause layout shifts when the two take up different space, according to the web.dev font best practices guide. Delivering the font earlier helps eliminate those shifts.
The same guide warns that preloading fonts has a cost: it takes browser resources away from other loads. Use it with judgment and only with the most important fonts.
An invented example
This is an invented example, not a real website. A fictitious store has a product page with an offer banner that loads one second after the text. The banner pushes the description down just when the visitor was about to tap "Add to cart", and CLS comes out red. It is fixed by reserving the banner's height with min-height, without touching anything else.

What is the recommended order of work?
The recommended order is to measure with real data, prioritize by impact and effort, fix one metric at a time and review the result over time. A report full of reds is not a task list: it is a list of questions.
- Measure with real data in the Search Console report and in PageSpeed Insights, and note which metric and which group of pages fail.
- Identify the cause in the templates that receive the most traffic: for LCP, which element it is; for INP, which interaction is slow; for CLS, which element moves.
- Prioritize each action by impact and effort. Start with what helps more pages with less work.
- Fix one metric at a time and measure again. PageSpeed Insights field data is calculated over the previous 28 days, so the change takes time to show.
- Review the report every month and watch new templates before publishing.
To organize this work I have prepared a Core Web Vitals reading template: a table per page with each metric's value, its color, whether the data comes from real users, the probable cause, the action and the effort. It is a tool of my own, not a Google recommendation. Download the Practical Core Web Vitals Guide (in Spanish, sent by email).
Frequently asked questions about Core Web Vitals
Are Core Web Vitals a ranking factor?
Yes, Google says its core ranking systems use Core Web Vitals. But there is no single page experience signal, and good results don't guarantee ranking high, according to Google's page experience page.
How long does the data take to update?
PageSpeed Insights field data covers the previous 28 days, so an improvement takes weeks to be fully reflected, according to its documentation. To see a specific change sooner, you can use Lighthouse lab data.
What do I do if my website doesn't appear in the Search Console report?
If the report says "No data available", the website is new or CrUX doesn't have enough data for the chosen device, according to the Search Console help. URLs without a minimum of data are omitted. Meanwhile, use PageSpeed Insights and its lab data.
Do I have to measure on mobile or on desktop?
On both. The Search Console report separates mobile and desktop, and web.dev recommends measuring the 75th percentile segmenting between both devices, according to its Web Vitals guide.
Do you need to be a developer to improve them?
Not for everything. Understanding the report, compressing images, removing scripts you don't use and reserving banner space is within reach of whoever manages the website. Splitting long JavaScript tasks or preloading the LCP resource usually requires a developer. This is my opinion, not Google's.
Reviewed on October 12, 2026 against Google's official documentation (Search Central, web.dev, PageSpeed Insights and Search Console help) by Alejandro Castillo Cantón.